Over 1,000,000 Hard Drives Benchmarked
For a description of how the tests are performed see the benchmark information page. In all cases, higher results are better, but there can be several factors that can impact on the accuracy of the results in the charts. These are detailed below.
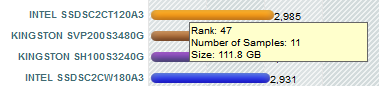
Due to the sheer number of harddrives available, for a Harddrive type to be included on the chart it needs to have had at least 15 submitted results. This restriction has been removed temporarily with the new release of PeformanceTest V8. Current inclusion rules are: at least 4 submitted results or 1 submitted results and archived PT7 result in database. This is to help avoid few single really good or really bad results from throwing a Harddrive type into a completely incorrect place in the chart. Due to the final score being an average of all benchmarks submitted for that Harddrive it is still possible for one or more incorrect results to throw off the whole result when there is a small sample size. For this reason we have included information in the graph about how many Harddrives of that type have been benchmarked. To see this information simply move the mouse over the bar of the Harddrive you are interested in. A higher sample size means the data is more likely to be accurate.
|
A RAM disk or RAM drive is a block of RAM that a computer's software is treating as if the memory were a disk drive. The performance of a RAM disk is in general orders of magnitude faster than traditional harddrives. Sometimes people who like to test their computers and submit results are also the kind of people who like to inflate the score of their computers. As such we generally filter these results.
The PerformanceTest software is designed to run on several different versions of Windows. So the results presented are a mixture of results from Windows 2000, 2003, XP, Vista & Windows 7. These different OS have different levels of efficiency and as such a specific computer might perform better or worse depending on what OS is installed.
There are many factors that affect the disk test results in a Windows Environment. Please see the following page for more information, Factors Which May Affect Disk Test Results
During the testing of the hard drive, if any other applications that may be running in the background that is also accessing the hard drive, it can affect the results.
Different versions of harddrive drivers can also have a large impact on the result. In some cases some of the PC's might have had configuration issues leasing to sub-optimal results. When a large number of samples are available this is not so much of an issue but when only a small number of results are available it can sway the results.
The rating the Harddrive’s are given here represents their peak performance for the type of load generated by the tests and will not necessarily match the real world performance with any specific software application or game.
Due to the fact that these graphs are automatically generated the names of the Harddrives's have been taken straight from the harddrive itself, via the SMART interface. At times, the naming of Harddrives by the manufacturers has been haphazard and because of this there will likely be some strange names in the graphs.
In some cases we have picked up names of rare or low volume Harddrives's. Just because you haven't heard of a particular Harddrives type, doesn't mean it doesn't exist.
Some drives might not appear in the chart for the following reasons:
A drive might have an unexpected name as some manufacturers are not setting the internal drive name to match the name they use to market the drive. For example the Intel 160gb X25-M SSD is also known as 'Intel SSDSA2MH160G1GC'. In other cases too little information is included by the manufacturer, and we don't know the precise model number or size. E.g. 'OCZ-Colossus'
Results from version 8, 9 and 10 of PerformanceTest have been used in these charts as the harddrive test from earlier versions of the software does not produce comparable results.
Due to the factors above, the results provide only a general guide to which drive perform better. Drives which appear close together in the graph (with less than 10% difference in their scores) should be considered roughly equal in performance. Only larger differences should be considered statistically significant.
 High End
 Drive Mega List
 Info to Decoding